If you are wondering what is Grafana, you have landed on the right platform. It is one of the most widely acclaimed and highly powerful monitoring solutions that have revolutionised how businesses monitor, visualise and analyse time series data. It facilitates organisations to acquire pertinent information about their data.
In this blog, we shall inspect what Grafana is as well as its features, definitions, advantages and functions. We will also review why it has been gradually becoming an irreplaceable tool for companies handling time series data. Therefore, if you are on a mission for an exhaustive overview of Grafana – then you have arrived at your destination!
Unravelling What is Grafana - A Brief Overview

Grafana is a highly efficacious open-source monitoring solution, much sought after by those in need of extensive dashboard visualisations. It facilitates data exploration and fault rectification as well as creating exquisite time-series graphs for bespoke dashboards. Native support for numerous platforms including cloud services is featured, along with an embedded query editor which can be employed to design intricate queries against your datasets in moments.
The interface of Grafana has been constructed according to up-to-date HTML5 standards and takes advantage of AngularJS components to make available real-time updates regarding the dashboards.
Its intuitive user interface renders it easy for users to handle their data sources, devise custom views and conduct intricate queries against them. For those aspiring for additional control over their data visualisations, Grafana offers a wide array of alternatives consisting of scatter plots, heatmap diagrams, histograms and treemaps – all of which are tailor-made according to the requirements of the user.
In addition, Grafana boasts an assemblage of capabilities such as alerting mechanisms that will inform when certain thresholds are exceeded and cross-service integrations which allow it to cooperate harmoniously with other third-party utilities. All these features make Grafana a priceless tool for any establishment wanting to gain insight into its business metric or conceive comprehensive dashboard visualizations.
Defining Grafana - A Comprehensive Explanation
Grafana is an open-source data visualisation and monitoring platform that has become widely utilised in several enterprise and small business environments. It grants users the ability to create graphs, dashboards, and alerts from diverse sources including time-series databases such as InfluxDB, Prometheus, Graphite, and Elasticsearch amongst many others.
With its primary focus being on delivering robust data analytics capabilities in a remarkably scalable fashion Grafana has established itself as one of the most highly sought after open source software solutions across enterprises globally.
At its core, Grafana provides a user interface that is intuitive with query languages which are powerful and serve to allow users to quickly assemble complex data visualisations as well as create customised dashboards. In addition, multiple authentication options such as LDAP or OAuth2 can be used by Grafana along with Role-Based Access Control (RBAC) for there to securely manage the roles of the users and access permissions within large organisations.
Furthermore, its plugin repository makes integrating Grafana with other popular open-source tools like Jenkins and Kubernetes simple for tasks concerning advanced automation. These features make Grafana an asset that cannot be underestimated when working in contexts involving significant amounts of real-time data-related activity, particularly on behalf of Data Scientists and Engineers who have this responsibility assigned to them.
A Deep Dive into Grafana Features
Grafana is an open-source metric analytics and visualisation suite. It is most commonly used for visualising time series data to facilitate infrastructure and application analytics, ]however it also supports other sources such as transactional databases, relational databases, cloud services and web APIs. Grafana has a highly developed dashboard-building capability which allows users to design visually attractive dashboards that can execute complex queries across multiple different data sources with ease thanks to its user-friendly interface; this allows sophisticated visuals to be produced quickly without difficulty.
To gain an understanding of how Grafana functions properly one must consider the core features that make up the platform. Grafana has an array of characteristics including assistance for data sources, a query editor, a dashboard builder, an alerting rules engine, plug-ins and authentication systems. By exploring each one of these features carefully we can gain greater insight into how they merge to form successful visualisations and dashboards which monitor various types of data. Data Source Support: Grafana offers support for many different data sources so that users can link directly to their chosen source to draw upon appropriate metrics or other information from those sources.
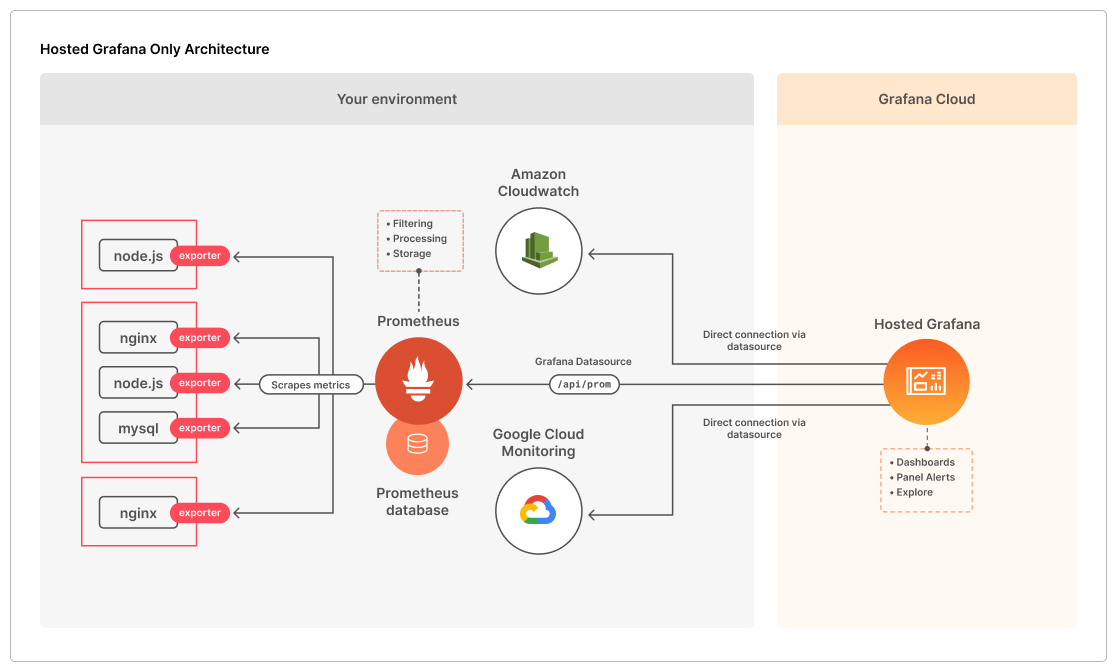
Supported data sources include Graphite, Prometheus, InfluxDB, Elasticsearch and AWS CloudWatch amongst others; allowing users to visualise data from any of these sources using a variety of techniques like tables or graphs. The Query Editor furnishes users with the ability to form complicated queries to reduce the scope of the dataset which is being seen on their dashboard. Queries can be modified according to time frame (in the last hour/day/month etc.), omit unwanted results (e.g., anomalies) or change format for presenting outcomes (i.e., adjust the y-axis scale).
Upon pulling data from one or more sources through the usage of the query editor, Grafana provides a convenient drag-and-drop interface for building custom dashboards that are populated with live data visualisations in real-time. An individual can further personalise their dashboard by adding annotations pinpointing specific events and measurements; setting thresholds on areas such as CPU utilisation; or implementing alerting rules which will activate notifications when predetermined conditions have been fulfilled (i.e., when service uptime falls beneath a certain threshold).
Grafana’s alerting system permits users to set up notifications which will be activated upon the occurrence of certain conditions within the dataset they are monitoring (for instance, sending an email notification should CPU utilisation fall below 10%). Beyond this pre-built functionality, there is a considerable number of plugins on hand that further extend Grafana’s capabilities (including adding backing for extra databases like MongoDB or Amazon RDS).
Furthermore, as well as providing robust visualisation capacities through its dashboard building toolsets, Grafana also offers advanced security measures such as Role Based Access Control (RBAC) permitting administrators to grant restricted access privileges in line with user roles inside a corporation or company. This feature is especially advantageous when dealing with confidential datasets and corporate networks needing specified levels of safety implemented across them consistently.
Notable Benefits of Implementing Grafana
Grafana has become increasingly sought-after in recent years as an open-source analytics platform with a wide range of features. Its growth can be witnessed across multiple industries, from retail to financial services, owing to its use for monitoring data and gaining insights quickly. The most remarkable characteristic of Grafana is that it allows users to query several sources of data through one interface so they may construct unified views easily.
Additionally, real-time alerts are available which could help identify patterns or trends within seconds. With its powerful visualisation tools too, correlations between different sets of information could be detected promptly and precisely.
Furthermore, the Dashboard Builder built into Grafana permits customers to generate customised dashboards expeditiously thus enabling them to show off whatever data is important at the time; finally, the authentication system incorporated into Grafana ensures only those authorised have access rights needed when accessing sensitive material stored on this platform. All these beneficial aspects make Grafana valuable no matter what company wants their data tracked efficiently or gain meaningful conclusions about business activity.
Exploring Different Uses of Grafana
Grafana is an open-source platform which is employed for data visualisation and monitoring, with particular attention being paid to time-series-based metrics. It furnishes a potent yet uncomplicated user interface that can be utilised to render diverse sorts of data sources visible. The adaptability of Grafana renders it ideal for the exploration of various kinds of information, ranging from system infrastructure metrics to financial trends.
Owing to its integrations with every foremost data source, users have enabled expeditious access as well as an opportunity to explore a broad range of details without having recourse to protracted setup procedures.
The capacity of Grafana to be applied in various ways makes it an ideal tool for both major organisations which have a vast quantity of data and minor enterprises searching for elementary solutions. As far as performance tracking is concerned, its format-agnostic approach renders great prospects. This implies that whether employing several databases or just one database provider, Grafana can afford users the opportunity to access their information straightforwardly.
This singular element has been paramount when it comes to assisting corporations with monitoring their system’s execution by providing dynamic graphics that give them the ability to detect operational issues and uncover answers more rapidly.
Furthermore, Grafana’s support for alerts allows users to set up notifications when certain thresholds are reached so that they can take timely action. Additionally, it has been highlighted earlier that beyond just being a powerful tool for data exploration, Grafana also offers the ability to generate appealing dashboards which give quick views of performance over time – appropriate both for presentations and disseminating information among peers.
Moreover, utilising its features one can explore other kinds of data including financial trends or customer behaviour patterns; in particular, by linking their CRM with this platform it would be possible to discern patterns between customers as well as note correlations relating them with external factors such as weather conditions or modifications in competition present within the market sector – essential knowledge regarding forming strategic decisions concerning plans.
How Grafana Leads in Data Visualisation?

Grafana has firmly cemented its place as the premier supplier of data visualisation technology. This is primarily attributable to its user-friendly interface, which enables all users irrespective of their technical proficiency to analyse and comprehend data accurately and proficiently with a single click. Pre-built visuals featuring comprehensive historical, real-time and alerting information from multiple sources can be accessed in this way.
Additionally, Grafana’s customisable dashboard creator empowers users to create highly sophisticated visuals that have been tailored specifically for them.
Another plus point for using Grafana lies in its scalability and flexibility; it can be implemented across on-premise, cloud or hybrid setups allowing organisations to monitor IT infrastructure over different domains without difficulty. What’s more, advanced features like authentication integration with LDAP/Active Directory permit companies not only to secure their info but also to capitalize on Grafana’s powerful capabilities effortlessly.
In conclusion, Grifona delivers an outstanding experience for those seekers looking for a holistic solution when monitoring performance metrics or analysing business trends quickly yet securely With numerous characteristics at hand alongside cutting-edge technologies underpinning the platform itself makes it clear why whyGrafan leads the field providing world-class solutions concerning data visualisation.
Grafana’s Impact on Business Intelligence
Grafana is an open-source metric analytics and visualisation suite that enables businesses to explore, apprehend and respond to their data. It endows a variety of effectual features that not only fortify the correctness of data analysis but also make it easier for organisations to acquire pertinent insights from their data.
By incorporating metrics from numerous databases, Grafana gives the user a comprehensive vision of the performance of their business. This augmented perceptibility can help recognise openings for progress, determine areas where resources could be reallocated most productively, and enhance overall process efficacy.
Furthermore, by creating dashboards which can simply be shared with stakeholders; Grafana provides a beneficial platform for establishments to convey news about any growth they may have accomplished or prospects concerning future endeavours.
Finally, through permitting companies to automate habitual roles whilst extracting further insight regarding operations at lightning speed; Grafana has revolutionised how firms utilise extensive amounts of information – as a result leading them to save both time as well energy in due course.
A Look at Grafana's User-friendly Interface
Grafana is a data visualisation platform that is utilised for the observation and examination of IT infrastructure and applications. Its user-friendly interface grants users easy access to explore their IT environment which allows them to detect potential issues, create reports as well and construct visualisations.
Fundamentally, Grafana is an open-source platform that permits its users to rapidly search through high volumes of information from multiple sources including on-site servers or cloud services such as Amazon Web Services (AWS) and Microsoft Azure.
The intuitive user-friendliness of Grafana’s interface makes it possible for users to select data points from multiple different sources through one single interface in a very swift manner. Though initially, the setup of a dashboard within Grafana may appear intimidating, with configuration complete it becomes incredibly effortless to investigate the details displayed on such dashboards. Additionally, pre-built dashboards featuring real-time monitoring metrics give organisations the capacity to quickly detect issues and respond rapidly thereto.
The functionality of drag-and-drop facilitates non-technical users to interact with the software without having any acquaintance with SQL or programming languages by permitting them to add elements such as graphs, tables and text widgets into their dashboards. Grafana’s user-friendly interface helps in improving decision-making across teams through its customizable visuals, like pie charts and bar graphs that can be connected for examining key performance indicators (KPIs).
Another aspect which makes using Grafana more convenient is its ability to assist users in keeping abreast of potential problems through proactive alerting techniques. Users have the possibility of preestablishing alerts based on specified conditions so they will obtain warnings immediately if something goes off-beam; this allows them to be informed beforehand rather than react late after an issue has already caused damage.
Moreover, alert capabilities can be extended using plugins such as Slack or PagerDuty allowing activities including sending notifications via email or SMS messaging meaning companies can swiftly respond when faced with critical situations or attempting optimising processes according to commercial needs.
Overcoming Challenges Through Grafana
Grafana is an open-source platform that enables users to monitor data and create visualizations and dashboards. It can be easily incorporated into a business to offer a complete system for collecting, managing and analyzing all types of data. Grafana’s application is especially useful when it comes to helping businesses manage their difficulties; it offers enterprises the capability of promptly visualising, analysing and sharing their facts in an organised way.
By using Grafana, individuals can acquire information from numerous sources including metrics databases, real-time streaming services or traditional relational databases.
By investing in Grafana, businesses can equip themselves with the means necessary to overcome many of the potential challenges encountered whilst handling large datasets. This is due to features such as its ability to identify data trends and anomalies quickly; thus enabling organisations to address any issues they may encounter promptly.
Furthermore, navigating complex datasets can be simplified by utilising Grafana’s user-friendly platform which incorporates elements including charts, histograms and heatmaps – allowing for effective analysis without necessitating considerable technical expertise. Additionally, this system also offers powerful alerting capabilities that allow companies’ systems to remain monitored 24/7 so that any critical matters arising can be identified immediately for decisions relating thereto to be made expediently.
As a result of these advantages business owners can make more efficient decisions quicker which will ultimately lead towards greater success overall amongst enterprises purchasing this service..
Real-Life Applications and Success Stories of Grafana
Grafana is an open-source data analysis and visualisation software which has been used for the monitoring and analysing of metrics from multiple sources. It has become a popular selection for businesses due to its features including user management, dashboard sharing, annotation, alerting as well and integrations with other systems.
Businesses have also taken advantage of Grafana’s capability in interactively providing information; this allows business owners to quickly assess major performance indices (KPIs) before making swift decisions.
In the example of Jira Service Desk, a software development tool utilised by engineering teams all over the world, Grafana was able to assist them in tracking their usage behaviour whilst also representing customer insights with visualisations. This facilitated both an improvement in their service provision and heightened customer experience. Not only that; however, Grafana holds strong evidence of its applications and successes – providing tangible proof-of-concepts or simply showcasing various use cases for potential clients.
An additional illustration would be the InfluxData platform which enabled companies like Microsoft Azure IoT Central to secure full visibility into their associated gadgets in close-to actual time – giving rise to increased speed along with cost savings across a range of departments including IT operations and software engineering. These examples show how Grafana can aid businesses in obtaining an improved understanding of their data while at the same time enabling them to formulate customised dashboards that can be distributed amongst team members or external stakeholders.
In addition, these usages demonstrate that it is achievable to make use of the mightiness of visualisation tools combined with metric aggregation tools for example Prometheus to acquire better comprehension of vital KPIs and take evidence-based decisions promptly.
Wrapping Up!
In conclusion, Grafana is a powerful and open-source monitoring and visualising platform for time-series data. Its easy-to-use dashboard-building features along with its advanced alerting capabilities and ability to directly query any database make it an extremely useful tool in terms of quickly obtaining valuable insights from the data.
From performance tracking to operational intelligence, the application has many uses which can benefit greatly from its impressive visualization abilities. Additionally, due to its scalability, it is perfectly suited for large-scale deployments too; furthermore as a result of how flexible this system is it makes manifestly evident why so many organisations look towards utilising such technology to gain invaluable understanding regarding their respective datasets.
Are you desirous of taking your career to the next level and becoming a DevOps master? Our DevOps Master Program could be just what is needed. This program has been tailored for those looking to secure advanced technical knowledge regarding DevOps tools and processes, as well as develop their aptitude in integrating them into businesses. Furthermore, individuals will gain comprehension of how to employ industry best practices to achieve effective automation and continuous delivery.
Should one enrol on our DevOps Master Program, they can obtain greater insight into the fundamentals that promote success within the sphere of DevOps and their bearing upon people, procedures and technology alike; plus through partaking in hands-on exercises combined with real-world projects alongside expert conferment – core talents sought by employers outsourcing such positions shall be achieved. Consequently, there should not be any reluctance to capitalise on this unparalleled opportunity today to join our master’s program!
Are you looking to further your career by becoming a DevOps Master? If so, then take advantage of our comprehensive DevOps Master Program today! Our program is designed for those who wish to become professionals in utilising the most up-to-date technologies. You shall gain mastery of all aspects needed as a developer from cloud computing and system administration through to automation and operational troubleshooting.
Upon completion of this course, you will have acquired knowledge on how best to comprehend complex software architectures and be able to generate reliable solutions which guarantee continuous delivery applications. Moreover, learning with us is very flexible since it can be done at one’s convenience; therefore don’t miss out – sign up now!
Happy Learning!


