

Are you preparing for an interview that involves Microsoft Power BI? If yes, then you have landed to the right place. Whether you are a beginner or an experienced professional, it’s crucial to be well-versed in the commonly asked interview questions related to Power BI.
In this comprehensive blog post, we will delve into various aspects of Microsoft Power BI interview questions from basic concepts to advanced techniques, we’ve got you covered!
Top 100 Power BI Interview Questions List
- What is Power BI?
- What are the components of Power BI?
- Differentiate between Power BI Desktop and Power BI Service.
- What are the benefits of using Power BI?
- Explain the architecture of Power BI.
- How does Power BI connect to data sources?
- What is Power Query in Power BI?
- What is Power Pivot in Power BI?
- What is Power View in Power BI?
- What is Power Map in Power BI?
- What is Power BI Embedded?
- What is Power BI Report Server?
- Explain the difference between calculated columns and measures in Power BI.
- What is DAX (Data Analysis Expressions) and why is it important in Power BI?
- How do you handle missing data in Power BI?
- What is a relationship in Power BI and how do you create one?
- How can you optimize performance in Power BI reports?
- Explain the concept of data modeling in Power BI.
- What is DirectQuery in Power BI?
- How do you handle large datasets in Power BI?
- What is Row-Level Security (RLS) in Power BI?
- How can you schedule data refresh in Power BI Service?
- What is the difference between Power BI Desktop and Power BI Report Server?
- How can you share Power BI reports with others?
- What is Power BI Premium?
- Explain Power BI gateway and its types.
- How can you implement row-level security in Power BI?
- What are the different types of visualizations available in Power BI?
- What is a slicer in Power BI?
- How do you create calculated columns in Power BI?
- What is the difference between calculated columns and measures?
- How do you handle errors in Power BI?
- Explain the concept of bookmarks in Power BI.
- How can you create custom visuals in Power BI?
- What are the limitations of Power BI?
- How can you connect Power BI to different data sources?
- Explain the difference between Power BI Pro and Power BI Premium.
- How do you create a dashboard in Power BI?
- What is the role of Power Query Editor in Power BI?
- How can you create calculated tables in Power BI?
- What is the use of Power BI APIs?
- Explain the difference between Power BI Desktop and Power BI Service.
- How do you handle multiple data sources in Power BI?
- What is the role of a data model in Power BI?
- How do you handle hierarchical data in Power BI?
- What is a composite model in Power BI?
- Explain the concept of aggregations in Power BI Premium.
- How do you implement dynamic security in Power BI?
- What is the difference between Power BI Desktop and Power BI Report Server?
- How do you deploy Power BI reports?
- What is Power BI Embedded and how does it work?
- How do you integrate Power BI with other Microsoft products like SharePoint?
- What are the different types of gateways in Power BI?
- How do you handle incremental refresh in Power BI?
- What is the role of Power BI Admin Portal?
- How do you handle dataset refresh failures in Power BI Service?
- What are the considerations for deploying Power BI in an enterprise environment?
- How can you optimize DAX queries for better performance?
- Explain the role of Power BI Mobile App.
- How do you manage permissions in Power BI Service?
- What are the limitations of Power BI Mobile App?
- How do you handle security in Power BI Embedded?
- What is Power BI Premium Per User?
- How do you integrate Power BI with Azure services?
- What are the best practices for creating Power BI reports?
- How do you handle time intelligence in Power BI?
- Explain the difference between calculated columns and measures.
- How do you optimize data models in Power BI?
- What is the role of Power BI Developer Center?
- How do you implement drill-through in Power BI reports?
- What is the role of Power BI Desktop Query Editor?
- How do you create calculated tables in Power BI?
- What are the limitations of Power BI datasets?
- How do you handle real-time data in Power BI?
- Explain the concept of Key Influencers visual in Power BI.
- What are the considerations for data privacy and security in Power BI?
- How do you handle dataset schema changes in Power BI?
- What is Power BI Service Principal?
- How do you automate Power BI report generation?
- Explain the difference between import and direct query mode.
- How do you create a custom connector in Power BI?
- What is the role of Power BI Dataflows?
- How do you handle large datasets in Power BI?
- What are the considerations for deploying Power BI on-premises?
- How do you handle currency conversion in Power BI?
- What is the role of Power BI App Workspaces?
- How do you handle data compression in Power BI?
- What is the difference between Power BI and other BI tools like Tableau?
- How do you implement data lineage in Power BI?
- What are the best practices for data visualization in Power BI?
- How do you integrate Power BI with Active Directory?
- What is the role of Power BI Mobile App in offline mode?
- How do you handle role-playing dimensions in Power BI?
- What are the limitations of Power BI service?
- How do you handle date hierarchies in Power BI?
- Explain the concept of Power BI Paginated Reports.
- What are the considerations for deploying Power BI in a hybrid environment?
- How do you handle dataset refresh failures in Power BI?
- What is the role of Power BI Gateway in cloud architecture?
- How do you monitor and optimize performance in Power BI reports?
Microsoft Power BI interview questions for freshers
1. What is meant by Microsoft Power BI? What are its major components?
Offered by Microsoft, Microsoft Power BI is software that allows you to collect data from various sources such as Excel, CSV files, or even cloud sources to analyze and present meaningful insights. It allows you to do so by creating interactive visual dashboards.
The dashboard could consist of various reports consisting of visuals including charts, graphs, KPIs, Bing maps, etc. For instance, the image below showcases a sample sales dashboard showing total sales and the revenue generated per unit.

There are three main components of Microsoft Power BI:
- Power BI services
- Power BI desktop
- Power BI services
2. What is the difference between Power BI and Tableau?
Microsoft Power BI | Tableau |
Microsoft Power BI is created by Microsoft. | Tableau is created by Salesforce. |
Microsoft Power BI can only handle a limited amount of data. | Tableau can handle an unlimited amount of data to work on. |
This tool is suitable for experts as well as beginners. | This tool is mainly a cup of tea for experts. |
Microsoft Power BI is not that good at connecting with cloud apps. | Tableau is able to support and incorporate the cloud with ease. |
Microsoft Power BI makes use of Data Analysis Expressions (DAX) to find quick measures, calculated columns, and new tables. | This software uses Multi-Dimensional Expressions (MDX) for measuring and dimensions. |
3. What are the different types of views present in Power BI?
There are three types of views available in the Power BI tool. You can switch between different types of views as they are present on the left side of the tool in a vertical manner. The three types of views are as follows:
- Data view: This is the view that shows the data in a tabular form after it has been fed to model. You can explore and view the datasets here.
- Model view: This is the type of view that allows you to watch relationships between different tables. You get an idea of data model in this view as one-to-one, one-to-many, and many-to-many relationships are represented through an Entity Relationship (ER) diagram in this view.
- Report view: The report view is a collection of different types of visualizations that have been created by making use of the data. You can create a large number of reports, merge them and apply various functionalities to reports.
4. Mention various data sources supported by Power BI.
The different data sources that are supported by Power BI are mentioned below. The data in these sources can be queried directly. These are:
- Amazon Redshift
- Azure Analysis Services
- Azure Data Explorer
- Snowflake
- Spark
- SQL Server
- Azure Databriks
- BI Connector
- MariaDB
- Sap Business Warehouse Server
- Impala
- IBM Netezza
- Azure SQL Data Warehouse
- Azure HDInsight Spark
- SAP HANA
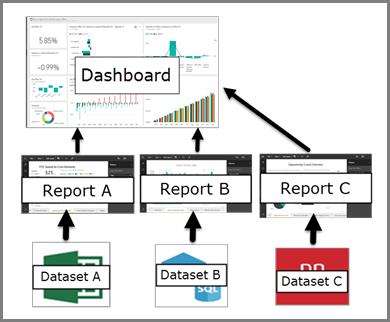
5. What is meant by a dashboard in Power BI?
A dashboard is a high-level form of a report that is formed from a collection of various reports. Reports are nothing but an in-depth analysis of data for a particular data set. When these different data sets are collected together and share a relationship with each other, a dashboard is formed.
In other words, only the most important data from different reports goes into a dashboard.
6. What is Power Query in Microsoft Power BI tool?
Power Query is an Extract, Transform, Load (ETL) tool. It is where the data is loaded inside Power BI and when it is saved, Power BI saves the metadata. You can use the Power Query to shape and transform the data.
It includes:
- Changing data formats, for instance, converting date from text to datetime format.
- Append or split data columns as needed.
- Clean and remove duplicate rows present in the datasets.
- Importing data from various sources such as databases (MySQL server, etc.) or files (CSV, Excel, etc.).
Note: M-code is the programming language used in Power Query.
7. What is meant by data modeling in Power BI?
There is often more than one data set to work on when trying to analyze the data. These various data sets must be connected with each other through various common fields to develop a relationship between them. This creation of relationships between various data sets is called data modeling.
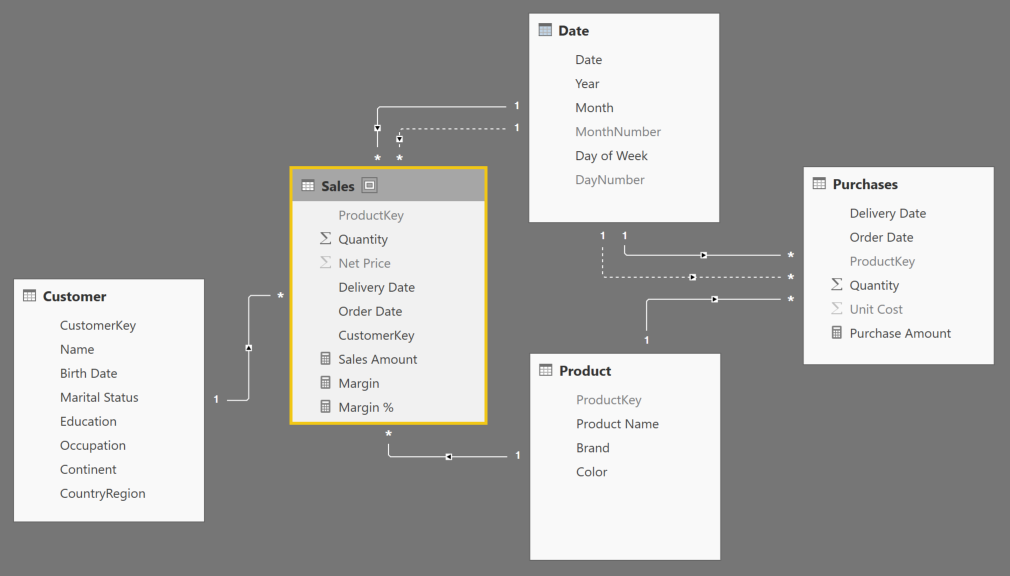
For example, in the above image, there can be seen many active relationships (marked by a solid line) and inactive relationships (marked by dotted lines) in the model view of Microsoft Power BI. There are one-to-many cardinality relationships in this model.
This is because only a single field is present in one table as compared to the other one.
8. What is meant by cardinality?
There are 4 main types of cardinality:
- One-to-one
- One-to-many
- Many-to-many
- Many-to-one
It is important to note that when joining two tables, one of the tables must contain a unique value in at least one of the joined tables.
9. What is meant by DAX?
Expanded as Data Analysis Expression (DAX), DAX are built-in collections of formulas or functions to carry out various calculations, and quick measures of creation of new tables in Power BI. DAX uses DAX language to work. You can get insightful results by making use of DAX.
For instance, if you want to find profit percentages in customer sales data, you can use DAX functions to do so.
10. What are some of the most commonly used DAX functions?
Some of the most commonly used DAX functions in Power BI are as follows:
- Filtering functions: FILTER, CALCULATE, TOPN, VALUES, ALL
- Aggregate functions: MIN, MAX, AVG, SUM, DISTINCTCOUNT, COUNTROWS
- Date and time functions: DATEVALUE, DATEDIFF
- Statistical functions: MEDIAN, STDEV.P, GEOMEAN
Microsoft Power BI interview questions for experienced professionals
11. What is meant by filters in Power BI? Mention various filters available in the tool.
Filters can be defined as logic that can be applied to visualizations present in the reports in Power BI to filter out columns/rows based on specific conditions. For example, if you want to showcase all the values that belong to the year 2016, you can filter out all the values by choosing ‘filter’ option present in the right pane in the software.
The various types of filters are as follows:
- Manual filters
- Auto filters
- URL filters
- Pass-through filters
- Drill-down filters
- Cross drill filters
- Drill through filters
- include/exclude filters
12. Mention the advantages and disadvantages of the Power BI tool.
The benefits of using Power BI are as follows:
- It allows the data to be imported from almost any kind of databases or files.
- You can get real-time updates or near-real-time updates in Power BI dashboards.
- The connection formed by Power BI with the data is stable and secure.
- You can create as many reports as needed in Power BI as all the data is stored as metadata in the Azure server.
- You can build interactive visual dashboards in data centers.
- You can transform, shape and run queries on the data using DAX in Power BI.
- The software responds quickly and efficiently without any hassle.
The disadvantages of using Power BI are as follows:
- The Power BI cannot handle large amounts of data, nothing more than 1 GB.
- Only a few data sources allow real-time connections to Power BI dashboards as well as reports.
- The cloud connections are not that stable in Power BI.
- The dashboards and reports can only be shared with users logging in with the same email address. No other person can access the reports/dashboards.
13. Mention the important stages involved in working with Power BI.
There are three main stages involved in working with Power BI. These are as follows:
- Data integration: This is the first step of working in Power BI, i.e., creating a successful connection with the data source such as files or databases. This is the extract stage of the ETL process where data is extracted to be processed.
- Data processing: This is the next stage where the data needs to be cleaned. This is also called data cleaning/processing. This involves the removal of empty, and null values, merging/splitting columns, changing column data type, etc.
- Data presentation: This is the last stage of working with data in Power BI. The data is then used to create visuals and prepare reports/dashboards in the software. You can then get valuable insights from these visuals.
14. What are the different data types available in Power BI with examples?
The different types of data types in Power BI are mentioned below:
- Date/time: Date, Duration, Date/Time, Time, etc.
- Text: whole number (Int64), decimal number, currency, percentage, text, etc.
- Boolean: True/False, On/Off, Yes/No, In/Out, etc.
- Binary: File, image URL, etc.
- Blank, variant, etc.
15. Mention the various types of users that can make users of Power BI.
Since Power BI is a Business Intelligence tool, a lot of business owners are the main users of Power BI. Some of the major users include:
- Data Analysts
- Business Analysts
- Business owners
- Data Scientists
- Power BI Developers
16. What are the different versions available of Power BI?
The three main versions of Power BI are as follows:
- Power BI Desktop:
- This is the most basic version of Power BI and is available for free.
- This is most suitable for students and candidates who want to learn Power BI.
- Data sets cannot have a storage of more than 1 GB.
- It can connect to multiple data sources. Interactive visuals can be created through the desktop version and ETL can be practiced.
- Power BI Premium:
- This is a high-level premium version that is suitable for large business organizations with dedicated storage for each user.
- It costs around $4995 per month.
- The premium version can load up to 50 GB of storage with an add-on 100 TB of storage on the cloud.
- Power BI Pro:
- You can get complete access to the Power BI dashboard, and report creations with the pro version of Power BI.
- This version is suitable for organizations where each user will have his/her own Power BI pro license. If you have 30 people in your organization, you will need to buy 30 licenses.
- You can have unlimited sharing of the report and viewing as well.
- There is a storage limit of 10 GB per user.
17. What languages are used in Power BI?
There are two main languages deployed by Power BI:
- DAX:
DAX is a programming language that is used in Data View after the data has been fed to the model and is ready for the creation of various visuals. You can use DAX functions to create new tables, columns, and quick measures. DAX is a case-insensitive programming language.
- M:
M is used in the Power BI Query Editor to prepare the data before it is even loaded into the model. It is a query formula language. It is a case-sensitive language.
18. What is SSAS? What are the main components of SSAS?
You can also access multi-dimensional models in Power BI by using the SQL Server Analysis Services (SSAS) in Power BI. You can fetch it by going to the Get Data tab.
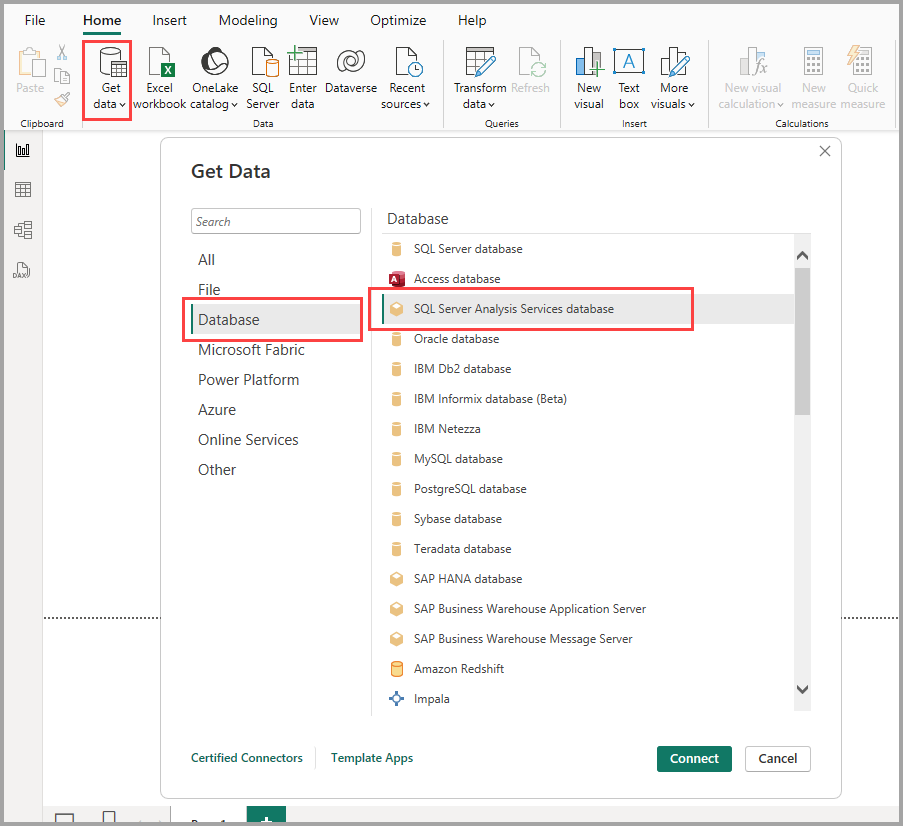
The main components of SSAS are as follows:
- OLP engine
- Data drilling
- Pivot tables
- Slicers
19. What are the data sources that Power BI can connect to fetch data?
There are three main types of data sources that can be connected to Power BI:
- Files: These include Excel files, Power BI desktop files, and Comma-Separated Files (CSV).
- Content packs: These are a group of related documents or files. These are of two types:
- Content packs from service providers: These include content packs from Salesforce, Google Analytics, etc.
- Content packs from sharing: These are packs shared by other people in a business organization.
- Connectors: You can connect to databases and datasets with services, apps and the cloud through connectors.
20. How can you optimize the performance of a Power BI report?
The following steps can be taken to optimize the performance of Power BI reports:
- It is important to clean the data and only load columns/rows that are actually needed. It is smart to remove null/empty fields.
- You can turn off time intelligence to prohibit Power BI from automatically creating a date/time hierarchy of date fields. This can slow down Power BI reports.
- It is always great to use the STAR schema while creating relationships.
- It is recommended to use quick measures instead of calculated columns to save space.
- You must limit visuals in a report.