

A Complete Wireshark Cheat Sheet for Beginners and Professionals

You are staring at hundreds of packets flying across your screen, a network issue is making your application crawl, and your boss wants answers in the next thirty minutes. Sound familiar? This is exactly where Wireshark earns its reputation as the gold standard of network troubleshooting tools.
Whether you are diagnosing a slow database connection, investigating suspicious traffic, or learning TCP/IP from the ground up, having a reliable Wireshark cheat sheet within arm's reach changes everything. This guide is built for both beginners trying to understand their first packet capture and seasoned professionals who want a fast reference for Wireshark commands, filters, and analysis techniques.
What is Wireshark
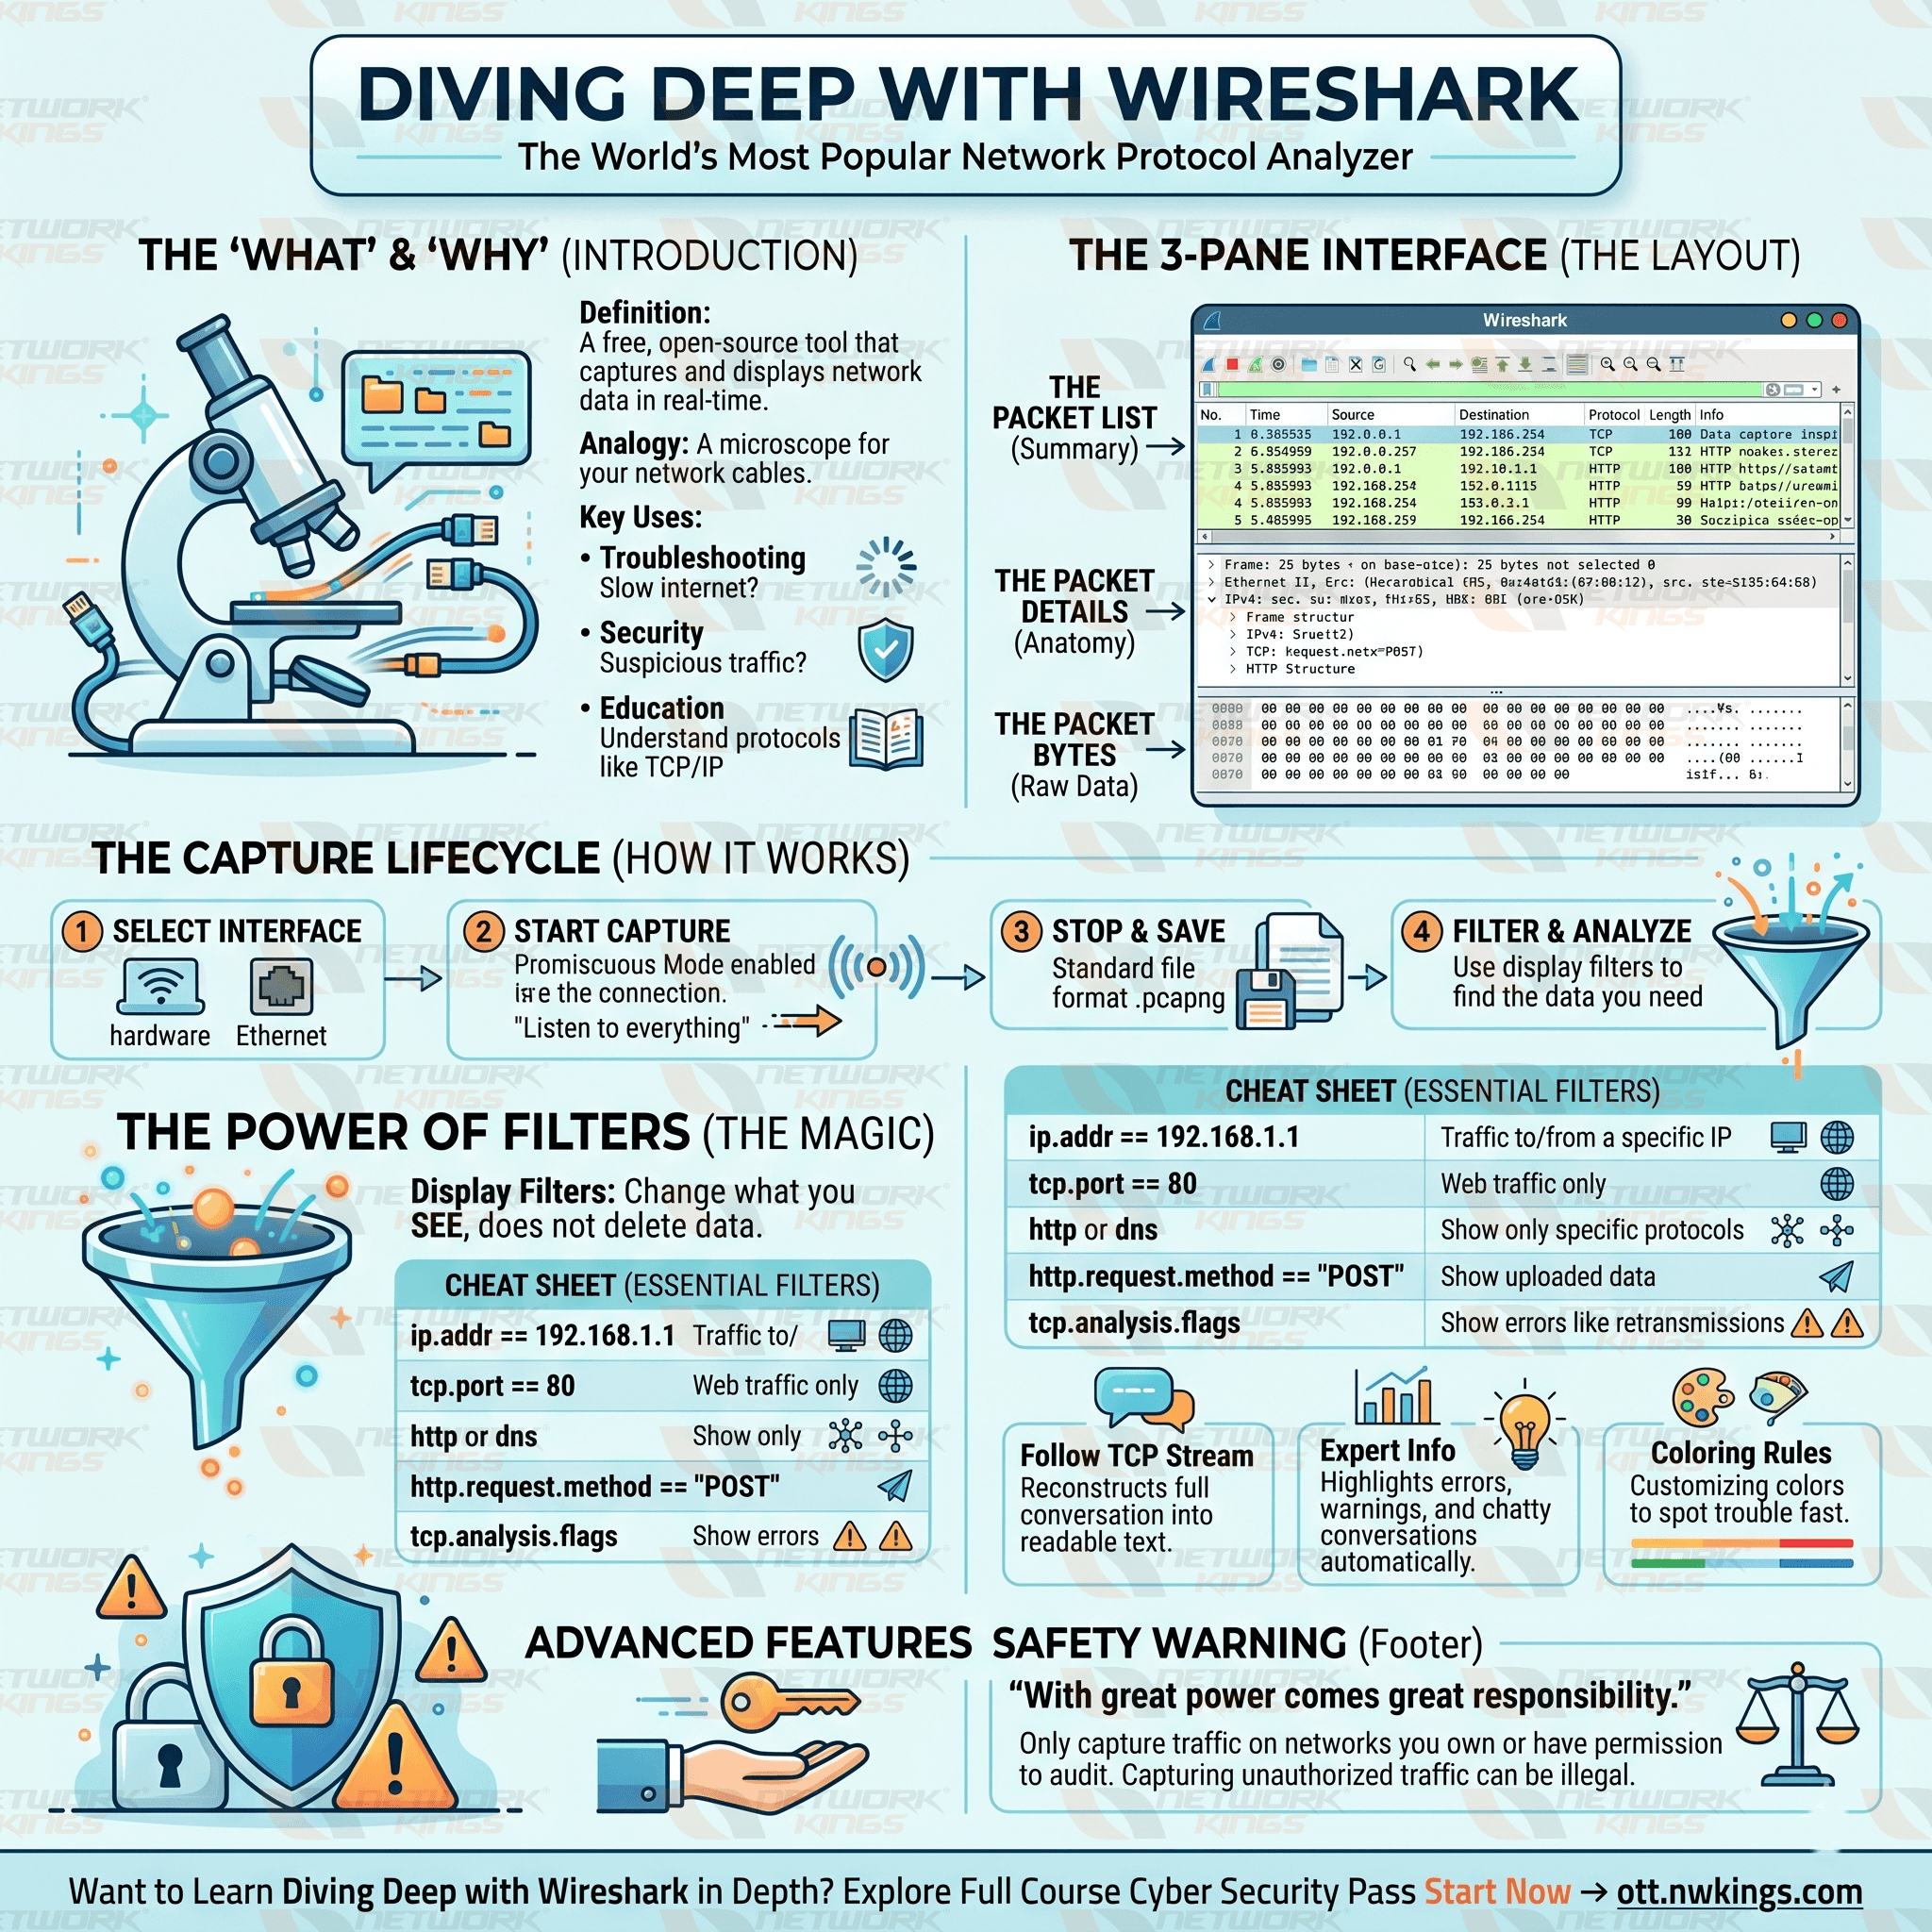
Wireshark is a free, open-source network protocol analyzer that captures and inspects live packet data on any network interface. Think of it as a microscope for network traffic. Every byte that travels across your network can be seen, filtered, and decoded in real time.
Who uses Wireshark:
Network engineers troubleshooting connectivity and performance issues
Security analysts investigating breaches or anomalous behavior
Developers debugging application-layer protocols
Students learning how TCP/IP, DNS, HTTP, and other protocols actually work in practice
Wireshark runs on Windows, macOS, and Linux, making it one of the most accessible network analysis tools available.
Why Every Network Engineer Should Learn Wireshark
Most monitoring tools give you a dashboard and a few alerts. Wireshark gives you ground truth. Here is why that matters.
When a ticket says "the app is slow," Wireshark tells you whether the slowness lives in DNS resolution, TCP handshake latency, server response time, or client-side processing. You stop guessing and start knowing.
From a security standpoint, Wireshark lets you see what no firewall log captures at the protocol level: malformed packets, unexpected connections, data being exfiltrated in DNS queries, or cleartext credentials traveling over HTTP. These are discoveries that change how teams respond to incidents.
For performance monitoring, Wireshark's built-in TCP analysis flags retransmissions, zero-window conditions, and duplicate acknowledgments automatically. That alone saves hours of manual digging on degraded WAN links or congested LAN segments.
Essential Wireshark Cheat Sheet
Installation and Launch
Task | Command / Action |
Launch with elevated privileges (Linux) |
|
Launch capture from terminal (CLI) |
|
Open a saved capture file | File > Open or |
Save current capture | Ctrl + S (Windows/Linux), Cmd + S (macOS) |
Common Capture Filters
Capture filters are applied before traffic is recorded. They reduce file size and processing load by only capturing packets that match your criteria. These use Berkeley Packet Filter (BPF) syntax.
Capture only traffic to or from a specific host:
host 192.168.1.100
Capture only TCP traffic on port 443:
tcp port 443
Capture traffic from a specific source:
src host 10.0.0.5
Capture traffic between two hosts:
host 192.168.1.1 and host 192.168.1.50
Exclude a noisy protocol like ARP:
not arp
Capture only HTTP traffic (port 80):
tcp port 80
Capture ICMP (ping) packets only:
icmp
Pro tip: Capture filters are best used when you already know what you're looking for. When investigating an unknown issue, capture everything and filter later using display filters.
Most Useful Display Filters
Display filters are applied after the capture. They are far more powerful than capture filters and use Wireshark's own filter syntax. This is where most of your day-to-day Wireshark work happens.
Beginner Display Filters
Filter | What It Does |
| Show all traffic to or from this IP |
| Show all HTTPS traffic |
| Show all HTTP packets |
| Show all DNS queries and responses |
| Show all ping traffic |
Advanced Display Filters
Filter | What It Does |
| Show only TCP SYN packets (new connections) |
| Highlight all TCP retransmissions |
| Show only HTTP POST requests |
| Show DNS errors and failed lookups |
| Show large frames that may indicate MTU issues |
| Exclude common noise to reduce clutter |
| Show all traffic from a private subnet |
Wireshark Shortcuts and Productivity Tips
Speed matters during an incident. Memorizing a handful of shortcuts cuts your analysis time significantly.
Essential keyboard shortcuts:
Shortcut | Action |
Ctrl + F | Open Find Packet |
Ctrl + G | Go to specific packet number |
Ctrl + E | Stop/Start capture |
Ctrl + Shift + F | Open Display Filter expression builder |
F5 | Refresh packet list |
Alt + Left/Right | Navigate through packet history |
Coloring rules are one of Wireshark's most underused features. Go to View > Coloring Rules to highlight TCP errors in red, DNS traffic in blue, or HTTP in green. During a high-volume capture, color-coded packets let you spot problems without reading every line.
Use Follow TCP Stream (right-click any TCP packet > Follow > TCP Stream) to reconstruct a full conversation between client and server. This is how you see what data was exchanged in plain text during a session.
Common Packet Analysis Techniques
TCP Analysis
Start by checking the three-way handshake: SYN, SYN-ACK, ACK. If you see SYN packets with no response, you have a routing or firewall problem. If the handshake completes but data transfer stalls, look for zero-window or retransmission events using the tcp.analysis.flags filter.
DNS Troubleshooting
Filter for dns and look at response codes. dns.flags.rcode == 3 means NXDOMAIN, indicating the domain does not exist. High DNS response times (visible in the Time column) suggest resolver issues or latency to the upstream DNS server.
HTTP and HTTPS Analysis
For unencrypted HTTP, http.response.code >= 400 will surface all client and server errors. For HTTPS, you cannot read the payload without the session keys, but you can still analyze handshake failures, certificate exchange, and connection timing using the tls filter.
Security Investigations
When investigating a potential compromise, look for beaconing patterns: repeated outbound connections at regular intervals to the same external IP. Filter by destination IP and check timing. Also look for unusual protocols on non-standard ports using tcp.port > 1024 and not http and not https.
Mistakes Beginners Should Avoid
Capturing on the wrong interface is the most common early mistake. Always confirm which interface carries the traffic you want before starting a capture. Use the packet count display next to each interface on the welcome screen as a clue.
Not saving captures is another frequent error. Live analysis is valuable, but captured files let you review traffic later, share with colleagues, or compare against a future baseline. Always save with File > Save As before closing.
Beginners often apply a display filter and assume packets outside the filter do not exist. They do. The filter only hides them. Keep that in mind when drawing conclusions about traffic volume or behavior.
Using Wireshark on a production network without proper authorization is a serious legal and policy risk. Packet capture is sensitive. Always confirm you have permission before capturing on any network you do not personally own.
Conclusion
A good Wireshark cheat sheet is not something you memorize once and forget. It is a living reference you return to as your skills grow and your network environments get more complex. The filters and techniques in this guide cover the scenarios most engineers and analysts encounter week to week.
Start with a simple capture on your own machine. Run a ping, open a browser, and watch what happens at the packet level. That hands-on experience with Wireshark commands and display filters is what moves you from reader to practitioner. The more captures you analyze, the faster your instincts develop.
Keep this cheat sheet bookmarked, and revisit it every time you sit down with a new network troubleshooting problem.
FAQ Section
Q1. What is the difference between Wireshark capture filters and display filters?
Capture filters control which packets are recorded during a live session using BPF syntax. They reduce file size but cannot be changed after capture starts. Display filters are applied to an already-captured file and use Wireshark's own filter language. Display filters are more flexible and can be changed at any time without restarting the capture.
Q2. Is Wireshark free to use?
Yes. Wireshark is completely free and open-source, licensed under the GNU General Public License. It runs on Windows, macOS, and most Linux distributions with no cost and no feature restrictions.
Q3. What are the most important Wireshark display filters for beginners?
The most practical starting filters are ip.addr == to isolate traffic by IP address, tcp.port == to filter by port number, http to see web traffic, dns to troubleshoot name resolution, and tcp.analysis.retransmission to spot network performance issues.
Q4. Can Wireshark capture encrypted HTTPS traffic?
Wireshark can capture HTTPS packets, but the payload is encrypted by TLS. To decrypt it, you need the pre-master secret log file from the browser or the server's private key. In most production environments, you analyze HTTPS at the handshake and connection level rather than reading the payload.
Q5. Is it legal to use Wireshark on a network?
Using Wireshark is legal only on networks where you have explicit permission. Capturing traffic on a network you do not own or administer without authorization can violate computer fraud and privacy laws in many jurisdictions. Always get written permission before running packet captures on any network that is not your own.

The founder of Network Kings, is a renowned Network Engineer with over 12 years of experience at top IT companies like TCS, Aricent, Apple, and Juniper Networks. Starting his journey through a YouTube channel in 2013, he has inspired thousands of students worldwide to build successful careers in networking and IT. His passion for teaching and simplifying complex technologies makes him one of the most admired mentors in the industry.

