How Cloud Monitoring Improves Performance and Reliability
Cloud environments give businesses the flexibility to scale applications, infrastructure, and services as demand changes. But that flexibility also creates a challenge. Without proper visibility, a slow application, overloaded server, network issue, or unexpected resource spike can quickly affect users. Cloud monitoring helps solve this problem by continuously tracking cloud infrastructure, applications, resources, and performance metrics.
By collecting and analyzing metrics, logs, and alerts, cloud monitoring helps teams identify performance bottlenecks, detect unusual behavior, and respond to incidents before they become serious outages. It improves not only cloud performance but also reliability, availability, and operational visibility.
What Cloud Monitoring Means
How does cloud monitoring work?
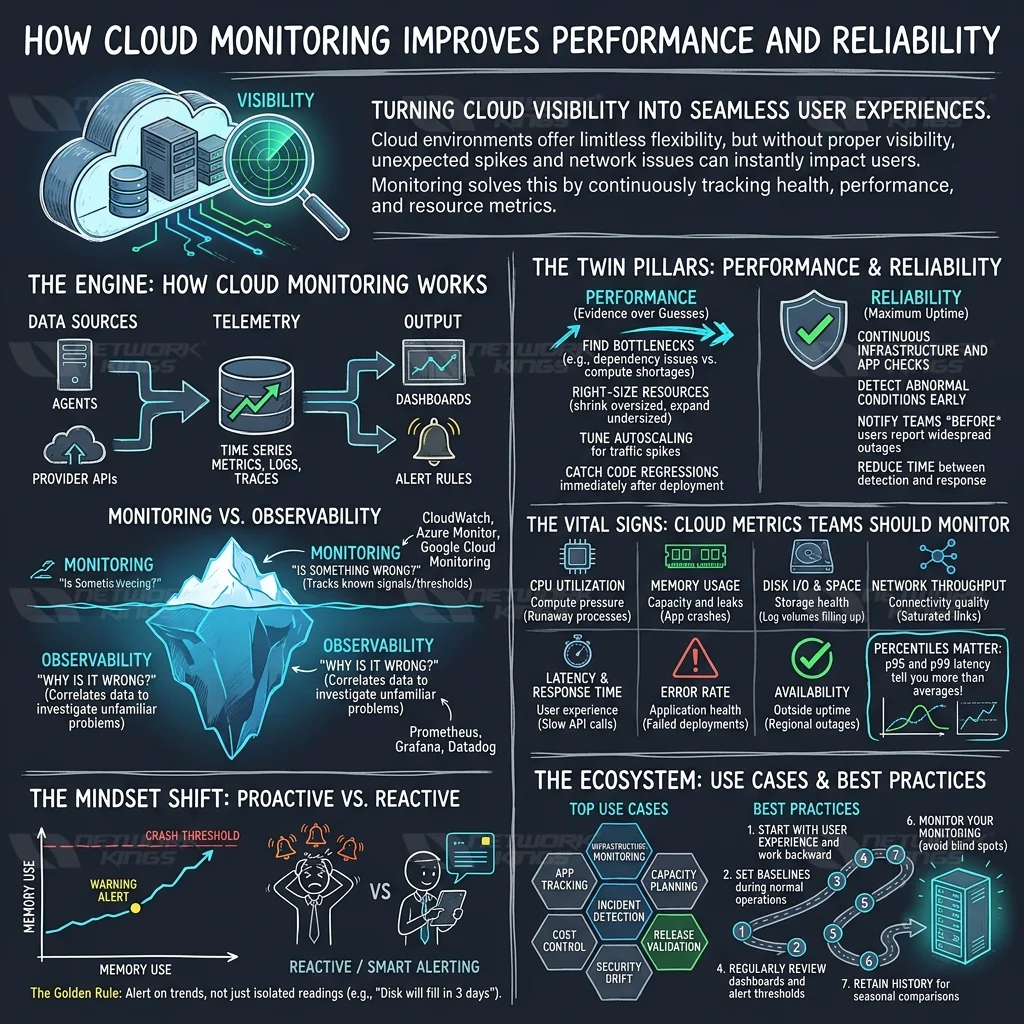
Monitoring tools gather data from your infrastructure and applications at regular intervals. Some data comes from provider APIs, and some comes from agents installed on virtual machines or containers. The tool stores this data as time series metrics, alongside logs and traces, then displays it on dashboards and evaluates it against alert rules.
Each major provider has native tooling. AWS monitoring typically relies on Amazon CloudWatch, Azure monitoring on Azure Monitor, and Google Cloud monitoring on Google Cloud Monitoring. Many teams add third-party monitoring tools such as Prometheus, Grafana, or Datadog, especially across multicloud setups.
What is the difference between cloud monitoring and observability?
Monitoring tracks known signals and tells you when something crosses a threshold. Observability goes further. It lets you investigate unfamiliar problems by correlating logs, metrics, and traces. Monitoring answers "is something wrong?" while observability helps answer "why is it wrong?" Most mature cloud operations teams need both.
How Cloud Monitoring Improves Performance
Cloud performance monitoring gives you evidence instead of guesses. When a page loads slowly, the cause could be the application code, a saturated database, network latency, or a throttled storage volume. Monitoring narrows the search quickly.
Here are the main ways it helps:
Finding performance bottlenecks, such as a service with rising response time while its CPU stays flat, which points to a dependency issue rather than a compute shortage
Right-sizing resources by comparing resource utilization against what you pay for, so you can shrink oversized instances or expand undersized ones
Tuning autoscaling by checking whether scaling rules trigger early enough to protect response time during traffic spikes
Catching regressions after a release, since a deployment that raises error rates or latency shows up immediately on a dashboard
Better scalability is a natural result. When you know how your application behaves under load, you can set scaling thresholds based on real behavior.
How Cloud Monitoring Improves Reliability
Reliability depends on an organization's ability to keep services available and recover quickly when problems occur. Cloud monitoring supports this by continuously checking infrastructure and applications for abnormal conditions.
Important reliability indicators include:
Service availability and uptime
Application error rates
Response time and latency
CPU and memory utilization
Network performance
Storage capacity
Failed requests and service errors
Consider a cloud application whose response time suddenly increases. An alert can notify the operations team before users begin reporting widespread problems. This gives the team an opportunity to investigate and resolve the issue while its impact is still limited.
Monitoring does not eliminate failures, but it gives teams greater visibility and reduces the time between detecting and responding to incidents.
Cloud Metrics Teams Should Monitor
The right metrics depend on your architecture, but most environments benefit from a core set across compute, network, application, and storage layers.
Metric | What it reveals | Example problem it can expose |
CPU utilization | Compute pressure | A runaway process or undersized instance |
Memory usage | Capacity and leaks | An application that slowly consumes memory until it crashes |
Disk I/O and space | Storage health | A log volume that fills up and stops writes |
Network throughput and packet loss | Connectivity quality | A saturated link between services |
Latency and response time | User experience | A slow API call that degrades checkout |
Error rate | Application health | A failed deployment returning 5xx responses |
Availability checks | Uptime from the outside | A region-specific outage |
Percentile values like p95 and p99 latency often tell you more than averages. An average can look fine while a small group of users suffers very slow requests.
How Proactive Monitoring Prevents Downtime
Reactive troubleshooting starts after users complain. Proactive monitoring starts when a trend turns unhealthy. The difference often decides whether an issue becomes a minor ticket or a major incident.
Trends matter more than isolated readings. A memory reading of 70 percent means little on its own. Memory climbing steadily by a few percent after every release suggests a leak that will eventually cause a crash. A disk at 60 percent is fine today, but if it grows at a steady rate, you can calculate when it will fill and act well before then.
Teams can build alerts around this idea. Instead of alerting only when disk usage reaches a hard limit, alert when projected usage will hit that limit within a set number of days. The same approach works for certificate expiry, database connection pool saturation, and queue backlogs.
Good alerting also means fewer alerts. If every minor spike pages an engineer, people start ignoring notifications. Alert on symptoms that affect users and on early warnings that need action.
Cloud Monitoring Use Cases
Application performance tracking for web apps, APIs, and microservices
Cloud infrastructure monitoring for virtual machines, containers, and managed services
Capacity planning based on historical growth in usage
Cost control by spotting idle or oversized resources
Incident detection and root cause analysis during outages
Security monitoring for configuration drift and suspicious activity
Validating releases, migrations, and failover tests
Cloud Monitoring Best Practices
Start with the user experience, then work backward to the infrastructure metrics that support it
Set baselines during normal operation so you can recognize abnormal behavior
Combine metrics, logs, and traces instead of relying on one data type
Review dashboards and alert rules regularly, since systems change and old thresholds become misleading
Assign owners to alerts and document what action each one requires
Monitor your monitoring, because a failed agent or broken alert route creates a blind spot
Retain enough history to compare weekly and seasonal patterns
Conclusion
Cloud monitoring connects performance and reliability through visibility. It shows where systems slow down, warns you when trends turn risky, and gives teams the evidence to respond quickly. Start with a focused set of metrics, build alerts that matter, and review them as your environment evolves. That approach delivers practical gains without drowning your team in noise.
FAQs
Why is cloud monitoring important?
It gives teams early visibility into performance issues, failures, and security events. Without it, problems usually surface through customer complaints, which means slower response and longer disruption.
How does cloud monitoring prevent downtime?
It detects warning signs such as rising error rates, resource exhaustion, or failing health checks, so teams can fix issues before they cause an outage. It cannot remove every risk, but it shortens detection and recovery time.
What metrics should be monitored in the cloud?
Start with CPU, memory, disk, network, latency, error rate, and availability. Add application-specific metrics, such as queue depth or transaction rates, as your needs become clearer.
What are the benefits of cloud monitoring?
The main benefits are faster incident detection, better resource utilization, more informed scaling decisions, and clearer insight into application performance and security.

The founder of Network Kings, is a renowned Network Engineer with over 12 years of experience at top IT companies like TCS, Aricent, Apple, and Juniper Networks. Starting his journey through a YouTube channel in 2013, he has inspired thousands of students worldwide to build successful careers in networking and IT. His passion for teaching and simplifying complex technologies makes him one of the most admired mentors in the industry.